Category Archives: Company News

Having Buy Discipline in the Eye of the Storm
I hope this finds you and your family safe and healthy. This month I would like to continue in our discussions of the importance of your advisor having both a buy and sell discipline. The last article I wrote detailed our firm’s math and rules based “Sell Discipline” and why we made the decision to move all our client’s assets to cash and stable value funds. Some of you may have seen last month’s rally and wondered if we have moved our positions back to the market. The answer is unequivocally: no. Rather I compare the current situation to being in the eye of the hurricane. After experiencing the devastation of a hurricane’s initial impact, it is easy to let your guard down as the winds subside and rain lets up. You may want to leave the safety of your shelter and venture outside. However, if you know the calm is merely temporary and danger is still close you will probably want to seek safety until the storm has truly passed.
April’s rally was not unprecedented. In fact, history has shown us that often after a significant downturn, the market will frequently have upticks before falling again. While we can’t know for certain what pattern this current market will follow, we do have our two guiding principles: history and math. In January 2009 saw the market up over 24% off the bottom before later setting a new low. Also, the head fakes during the 1987 crash, Dot-Com Bubble, and Great Recession took an average of 89 days, meaning that it took an average of nearly three months before setting new lows. The government’s significant financial intervention was a huge factor in helping to subdue the markets. The government’s quick response was unlike any other we have seen in past market crashes, and it certainly went a long way to reassure investors. However, it may not be permanent fix to an already fragile situation. Regarding the math we use, our recession indicators did not fall for the head fakes during the previous two corrections. Our program did not reverse positive until the long- term positive trends were confirmed. Even with April’s strong performance, our long-term indicators remain negative, meaning that we will remain on the sidelines for now.
It is also important to have a grasp on what is happening within all areas of the market, not just one or two indexes (like the S&P500 or Dow Jones Index). Most investors are diversified in a broad number of asset classes. Our program looks at all asset classes and sectors and then ranks them from strongest potential to weakest. Up until early March 2020, domestic equities had been the strongest area without a close second since 2009. We have not had any international or emerging market exposure for over 2 years. Currently, our program has Cash being the number one area with fixed income being second. Domestic equities are current ranked third and are close to being surpassed by currencies. As such, we remain invested in cash positions.
Another area that should be considered are the underlying fundamentals of the market. We do believe that the coming information regarding corporate earnings, unemployment, and GDP will likely be dismal for the foreseeable future. A recession looks extremely likely as it seems the damage created in the second quarter will have lasting impacts on both large and small corporations, even after the US economy can fully open. When we will be able to truly open remains another uncertainty as it is expected that we will continue to see spikes in COVID-19 activity until we have achieved a significant level of herd immunity or there is a viable vaccine. Experts say both options are still a long way away.
What do we do? We continue to monitor our math and rules-based program and wait in safety until the facts show that the storm has truly passed. The volatility we are experiencing on a weekly (and sometimes even daily) basis is something even the most seasoned advisors have not experienced before. In short, we still stand by the belief that the risk continues to outweigh reward potential. It is possible that we will not retest the market lows we saw in in March. Our long-term indicators will begin to move positive when the biggest risks are behind us. No one has a crystal ball, but if we are to error, we choose safety for our clients. As our indicators begin to turn positive again (and we know that they will), we will begin our transition back to holding equity positions. The process will be thoughtful and methodical as we will use our program to buy areas of the market showing the strongest momentum and will continue to avoid the weakest ones. This approach has allowed our models to outperform the S & P 500 index while still seeking to preserve our client’s principal. We look forward to finally seeing this financial storm pass us by and the sunny skies that will ultimately prevail. Our country is comprised of strong and resilient people and we know that in time “this storm shall pass”. If you have any questions about our methodology or if you should consider making any updates to your current holdings, we would love the opportunity to speak with you.
 Ashley Rosser, President
Prior to her career in the financial services industry, Ashley earned her Bachelor of Science in Nursing from Cedarville University.
Ashley decided to make a career change from her ten years within the healthcare industry as a pediatric emergency room nurse to retirement and 401K investment planning. She joined Victory Wealth Partners in 2008 after obtaining her Series 65 professional financial license and went on to earn her AIF (Accredited Investment Fiduciary) professional designation from the Center for Fiduciary Studies.

The ABC’s of Economic Recovery
If you have been watching the news lately, you may have heard phrases such as “V-shaped economic recovery” thrown around when discussing the economic recovery after the coronavirus outbreak. We would like to take a second to discuss the different types of economic recoveries, historical examples of each, and what we can do to avoid a worst-case scenario.
Download Printable Article (PDF) >>>
The best-case scenario when regarding an economy recovery is known as a V-shaped recession. Just like its name states, these recessions tend to occur as a steep decline that is followed by a rapid recovery. A recent example of this type of recession is the 1990-1991 recession, as the recession only lasted from July 1990 to March 1991. For a V-shaped recovery to occur, it would require many best-case scenarios. Testing would have to become readily available by early summer, allowing social distancing guidelines to be relaxed by May. Also, this would require a significant buildup of demand to be unleashed as soon as businesses reopen, as well as businesses rehiring most of the employees that had been fired or furloughed.
Another type of economic recovery is known as a U-shaped recession. A U-shaped recession is simply a prolonged version of a V-shaped recovery, characterized by a prolonged drawdown with a prolonged recovery period. A recent example of a U-shaped recovery is the Great Recession, as the economic drawdown was prolonged and followed by a muted but gradual recovery. A U-shaped recovery would be fueled by a shutdown that extends into the summer months and sees a sizable number of workers that are unemployed unable to return to their previous jobs. Also, while there may be pent up demand, businesses may not get the boom they anticipate if consumers continue to be cautious in public.
A W-shaped recession, better known as a “double-dip recession,” occurs when the economy has a short spurt of economic growth following a drawdown, only to be followed by another economic drawdown before completely recovering. An example in modern history is the 1980-1982 recession. While the economy had an initial drawdown followed by a recovery, the combatting of stagflation (inflation during high unemployment and economic demand stagnation) led to a second and final drawdown that successfully halted the spiking inflation. A W-shaped recovery would most likely be triggered by a second wave of the coronavirus. In this scenario, states may prematurely reopen, causing the flattening curve to spike all over again. In this instance, while the economy may get a boost from the initial reopening, the shutdown that would coincide with the second wave would lead to an additional economic drawdown.
The worst-case scenario for a recovery is known as an L-shaped recession. An L-shaped recession involves a sluggish recovery that can take years (sometimes even decades) to recover from; depressions are known as L-shaped recessions. A classic example of this type of recession is the economic slowdown in Japan following their robust, post-World War II economic prosperity. Once their asset bubble popped, a combination of stagnant economic growth and deflation led to a prolonged depression best known as the Lost Score. An L-shaped recovery typically involves a perfect storm of worst-case scenarios. For this to occur, we would imagine that the stay-at-home orders would extend through most of this year, if not into next year. Also, an L-shaped recovery would require a high default rate for businesses on their loans, as well as an unanticipated number of bankruptcies of businesses of all sizes. Finally, people may be indefinitely fearful of entering public spaces, leading to a prolonged decline in consumer spending outside of necessities.
While we wish we had a crystal ball to know for certain what path the virus and our economy will take, we have to continue to monitor the technical and fundamental strength of the economy and, in turn, the stock market to make our next decisions. On the technical side, more than half of our recession indicators continue to show a negative reading; in fact, none of them have returned to a positive reading. On the fundamental side, we believe that we have yet to truly see the economic impact of this shutdown. Unemployment continues to rise, and second quarter estimates of US GDP (Gross Domestic Product i.e the goods and services produced inside the U.S.) are indicating historically low levels. In short, we have yet to see material changes in either of these categories that would indicate a positive reading for the economy. However, we are continuing to watch both factors daily, and we will notify you when we see a shift in either of them. In the meantime, don’t hesitate to reach out if you have any additional questions or concerns.
Thank you,
Bud Verfaillie & Ashley Rosser
 Bud Verfallie, CEO
Bud holds several professional designations including: AIFA (Accredited Investment Fiduciary Analyst/Center for Fiduciary Studies), PPC (Professional Plan Consultant/Financial Service Standards), and CFP (Certified Financial Planner/College of Financial Planning), ranking him in the top 1% of all Investment Consultants nationally.
Bud has been an instructor/trainer for over 25 years. Subjects include: “How to Initiate a Successful Asset Management Business in Your Accounting Firm”, “Converting Your Commissioned-Based Investment Practice to Fee-Based”, “How to Establish an Asset Management Practice”, and “Investments and Financial Planning.” Bud has taught financial planners CFP Preparatory classes for the NIF.
Ashley Rosser, President
Prior to her career in the financial services industry, Ashley earned her Bachelor of Science in Nursing from Cedarville University.
Ashley decided to make a career change from her ten years within the healthcare industry as a pediatric emergency room nurse to retirement and 401K investment planning. She joined Victory Wealth Partners in 2008 after obtaining her Series 65 professional financial license and went on to earn her AIF (Accredited Investment Fiduciary) professional designation from the Center for Fiduciary Studies.

Having Patience During Market Volatility
We know that some of you may be feeling FOMO (Fear of Missing Out) towards the market at this time, so we would like to provide additional commentary on what we are seeing in the market and the economy as a whole.
One of the ways in which to track the stock market’s value is by comparing the market’s level to its earnings-per-share, or EPS. The notion is that, the larger the ratio of market level to EPS, the larger the overvaluation is of the market’s value. However, the key to this valuation formula is currently in a serious flux: earnings. Due to the volatile and unpredictable nature of this global crisis, we will look at two scenarios with which to project the earnings. The first scenario is the best-case scenario that involves the economy beginning to reopen by late summer and fully reopening by fall. In this scenario, projected EPS around $140 would imply that the market is close to fair value at this point. In the second scenario, we would assume that, with no immediate vaccine in sight and a potential second wave of infections, the economic shutdown will be prolonged. In this instance, a more pessimistic EPS projection around $120 would imply that the market has an additional 20%+ to decline. With the way the situation is continuing to unfold, it is difficult to know exactly which path our economy will take at this point.
Another line of thinking may be, “well, if I can’t know for certain what the economic fallout will be, it’s best for me to just jump in now and see what happens.” While buying and holding for the long run can be an effective strategy, history shows us that avoiding volatile times (including volatility to the upside) can be even more effective. We decided to look at two time periods (1980-Present and 2000-Present) to see how an investor would perform if they missed the 20 best and 20 worst days in each of those periods. As a refresher, we mentioned in a previous article that the majority of the largest down and up days in market history were during recessions, and this is due to their volatile nature. If you bought and held the S&P 500 from 1980 until yesterday (April 6), you would have been up roughly 2,370%. However, if you had missed the 20 best and 20 worst days during the same timeframe, you would have been up nearly 3,390%. Likewise, an investor who bought and held from 2000 until yesterday would be up a little over 81%. In contrast, an investor who missed the 20 best and 20 worst days since 2000 would be up nearly 104%. In short, missing volatile time periods tends to outperform buying and holding through these times.
While we can’t know for certain what pattern this downturn will follow, we do have our two guiding principles: history and math. As we have mentioned before, history tells us that it is a regular occurrence during recessions to have head fakes to the upside; January 2009 saw the market up over 24% off the bottom before later setting a new low. Also, the head fakes during the 1987 crash, Dot-Com Bubble, and Great Recession took an average of 89 days, meaning that it took an average of nearly three months before setting new lows. For perspective, our most recent potential head fake began on March 25th, meaning we are only 13 days into this uptick. Regarding the math, our recession indicators did not fall for the head fakes during the previous two corrections; when they reversed up, it was because thepositive trend in the market confirmed itself. Even with Monday’s strong performance, our indicators remain negative, meaning that we continue to suggest remaining on the sidelines at this time.
One reason FOMO may feel more intense this time may be due to the size of these up and down days. In the Dot-Com Bubble, there were three days where the market was up 5%+ and one day where the market fell more than -5%. In the Great Recession, there were seven days where the market was up 5%+ and 12 days where the market was down more than -5%. As of yesterday, there have already been five days where the market has risen more than 5% and four days where the market has fallen more than -5%. In a little over a month, we have surpassed the Dot-Com Bubble and are well on our way towards surpassing the Great Recession in terms of these large, single-day moves. A significant reason for these large moves is the algorithmic trading done by institutional traders today, as these formulas can trigger mass selling or buying once the market reaches whatever criteria are required by the algorithm; the sheer size of these up and down days may be why investors feel abnormally antsy about missing out on the upturn.
The history and the math tell us to not only remain vigilant with our analyses, but to also remain patient. Most projections show that we have yet to even hit the peak of the coronavirus’ impact, and the true economic ramifications on companies and industries are yet to be seen. It can be difficult as an investor on the sideline to see days where the market is up multiple percent, but that this is a regular occurrence in bear markets. We will continue to monitor things daily, and we will let you know of any material changes we see in our indicators. In the meantime, we advise that you remain vigilant, stay safe, and pace yourself: economic downturns are a marathon, not a sprint. The S&P 500’s most recent low was 15 days ago, and these trends can take months to confirm or reverse. In short, there is a reason that patience is a virtue.
Thank you,
Bud Verfaillie and Ashley Rosser
Bud Verfallie, CEO
Bud holds several professional designations including: AIFA (Accredited Investment Fiduciary Analyst/Center for Fiduciary Studies), PPC (Professional Plan Consultant/Financial Service Standards), and CFP (Certified Financial Planner/College of Financial Planning), ranking him in the top 1% of all Investment Consultants nationally.
Bud has been an instructor/trainer for over 25 years. Subjects include: “How to Initiate a Successful Asset Management Business in Your Accounting Firm”, “Converting Your Commissioned-Based Investment Practice to Fee-Based”, “How to Establish an Asset Management Practice”, and “Investments and Financial Planning.” Bud has taught financial planners CFP Preparatory classes for the NIF.
Ashley Rosser, President
Prior to her career in the financial services industry, Ashley earned her Bachelor of Science in Nursing from Cedarville University.
Ashley decided to make a career change from her ten years within the healthcare industry as a pediatric emergency room nurse to retirement and 401K investment planning. She joined Victory Wealth Partners in 2008 after obtaining her Series 65 professional financial license and went on to earn her AIF (Accredited Investment Fiduciary) professional designation from the Center for Fiduciary Studies.
The opinions voiced on this website are for general information only and are not intended to provide specific advice or recommendations for any individual. All performance referenced is historical and is no guarantee of future results. All indices are unmanaged and not be invested into directly. The Standard & Poor’s 500 Index is a capitalization-weighted index of 500 stocks designed to measure performance of the broad domestic economy through changes in the aggregate market value of 500 stocks representing all major industries.

Precedent for Unprecedented Times
With the recent swings in the market, we wanted to provide a new update on what we are seeing in the market and the economy. This week has seen some strong returns, particularly on Tuesday, when the S&P 500 index posted its eighth-highest daily return in history at 9.38%. Individuals may be feeling like a day as strong as this is proof that the worst of this crisis is behind us, and we would love that to be true. However, we would like to provide some historical context and precedent in these unprecedented times.
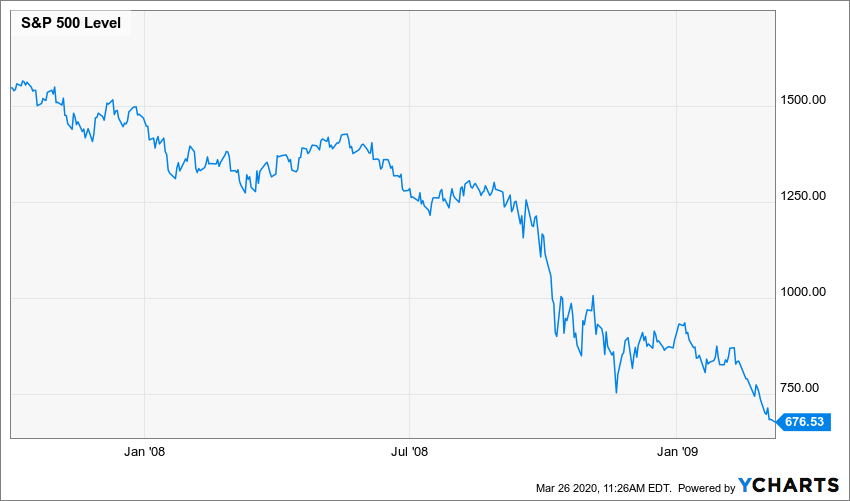
As was previously mentioned, there have only been seven days in the S&P’s history in which the market posted a greater daily return than the one we saw on Tuesday. In order from largest to smallest, these other seven days happened in 1933, 1929, 1931, 1932, twice in October 2008, and 1939. Anyone familiar with history will recognize that, yes, the largest up days in market history happened during the Great Depression and Great Recession, which can seem counterintuitive. The two modern-day examples in October 2008 are an interesting case study. On October 13, 2008, the S&P 500 posted a return of 11.58%. If you were an investor who started to feel FOMO (Fear of Missing Out) about potentially missing the beginning of the next bull market and entered the market after this day, you would have experienced a decline of over -32% after this day. In fact, as soon after as October 22, 2008, the market was setting a new low. On October 28, 2008, the S&P 500 had a return of 10.79%. Now, if you refused to act on the first large up day but saw this day as confirmation, you would have experienced a decline of roughly -28% before the market bottomed out on March 9, 2009. While this isn’t to guarantee that we will see this sharp of a decline after Tuesday’s strong day, it does tell us that these days are far from a signal that we are out of the woods.
Also, another aspect of recessionary drawdowns is continual fluctuations off the bottom before setting new lows. We decided to look at the past two recessions, as well as the crash of 1987 to see if there is a precedent for these kinds of upswings during bear markets. In 2008, the S&P 500 had five separate instances where the index was 10% or more off the bottom before pulling back and setting a new low. In fact, on January 6, 2009, the S&P 500 was over 24% off the bottom before losing these gains in the following two months. In 2000, the S&P 500 once again had five separate occasions where the index was over 10% off the bottom before setting new lows shortly thereafter.
On January 4, 2002, the market was over 21% off the bottom before pulling back -33.75% afterwards. Lastly, even a crash as fast as Black Monday saw the market over 10% off the bottom before pulling back and setting a new low a little over a month later. As of Wednesday’s close, the S&P 500 is now 10.64% off the bottom. While these improvements are a welcomed sight, history has shown us that the market simply having upturns during bear markets is not unprecedented and typically isn’t an end-all signal that it is time to enter the market again.
Now that we have discussed precedent for these situations, let’s discuss some of the unprecedented events happening today. Today it was announced that unemployment claims last week were 3.28 million, which not only is nearly five times the previous record high from 1982, but it is also much higher than the consensus estimates of 1.5 million by economists surveyed by Dow Jones. Also, recent estimates by some of the largest banks are projecting U.S. GDP (a measure of the amount of goods and services produced in the U.S.) to decline anywhere from -14% to -30% in the second quarter of this year, in no small part due to the social distancing and quarantines we have seen. While these levels are unprecedented, the hope would be that this kind of a contraction will be short-lived. However, with many service industry employees (particularly in restaurants and entertainment) being laid off, it is difficult to exactly project how this recovery will take shape.
While we are experiencing both unprecedented and precedented times during this crisis, one crucial aspect regarding investing is to stay the course. More than half of our recession indicators continue to maintain a negative reading, which means that we suggest remaining on the sidelines for now. When we begin to see strength return to these indicators, we will begin our reintroduction into the market. However, we have yet to see any material improvement in any of the indicators, even after Tuesday’s upswing. In fact, none of the indicators through 2000 and 2008 fell for any of the false 10% upswings; the indicators only began gaining real strength when the recessions were truly finished. Remember, a math-based process can remove the two most dangerous emotions for an investor: fear and greed. In the past, we have cautioned against reacting fearfully during corrections, but we also want to caution against reacting with greed when it comes to entering the market again; a buy discipline is just as crucial to an investment process as a sell discipline. We will continue to monitor things daily to see if this week’s movement is another historical head fake, or if it is a sign of strength returning to the market. In the meantime, if you have any questions or concerns, don’t hesitate to reach out.
Thank you,
Bud Verfaillie and Ashley Rosser
Bud Verfallie, CEO
Bud holds several professional designations including: AIFA (Accredited Investment Fiduciary Analyst/Center for Fiduciary Studies), PPC (Professional Plan Consultant/Financial Service Standards), and CFP (Certified Financial Planner/College of Financial Planning), ranking him in the top 1% of all Investment Consultants nationally.
Bud has been an instructor/trainer for over 25 years. Subjects include: “How to Initiate a Successful Asset Management Business in Your Accounting Firm”, “Converting Your Commissioned-Based Investment Practice to Fee-Based”, “How to Establish an Asset Management Practice”, and “Investments and Financial Planning.” Bud has taught financial planners CFP Preparatory classes for the NIF.
Ashley Rosser, President
Prior to her career in the financial services industry, Ashley earned her Bachelor of Science in Nursing from Cedarville University.
Ashley decided to make a career change from her ten years within the healthcare industry as a pediatric emergency room nurse to retirement and 401K investment planning. She joined Victory Wealth Partners in 2008 after obtaining her Series 65 professional financial license and went on to earn her AIF (Accredited Investment Fiduciary) professional designation from the Center for Fiduciary Studies.
The opinions voiced on this website are for general information only and are not intended to provide specific advice or recommendations for any individual. All performance referenced is historical and is no guarantee of future results. All indices are unmanaged and not be invested into directly. The Standard & Poor’s 500 Index is a capitalization-weighted index of 500 stocks designed to measure performance of the broad domestic economy through changes in the aggregate market value of 500 stocks representing all major industries.

Why We Went to Cash – Market Indicators
This article was hard for me to write this month. It almost seems trivial to write about financial matters when we are worried about our families staying safe and our businesses remaining open. When COVID-19 is over medically, we know we will have to assess the damage done financially. I do not take any of this lightly.
Click Here for a Recent Update >>>
I think there are important questions that investors should be asking right now. I wanted to share what our firm did for our clients and why it may be appropriate for you.
We went to cash. Yep. You read that right. We sold all our equity positions in the market. I know your saying “but that goes against everything my advisor is telling me to do”. Yes, we know. If you have been following my blogs, you may recall that we use a math-based program to help us determine how we should be invested. Our Investment Committee is comprised of five firms from across the nation which utilizes the same math-based program, and it has been around for over 30 years. The first question we answer is, should we be in the market or be in cash to preserve principal? Since May 2009, stocks have been the best place to be. All that began to change three weeks ago.
We track six indicators that help determine the overall strength of the stock market. When a majority are positive, we remain in the market. If 4 or more go negative, it is a sign that there are significant technical and fundamental underlying deficiencies in the market. The indicators are not affected by short-term volatility.
Initially, we observed minimal changes as the volatility was related to fear sell off and not underlying issues. But, as companies, industries, states and entire countries shut down, those indicators were changing rapidly. On March 12th, three indicators went negative, then another two on March 17th, meaning that five of our six indicators were negative. Our Investment Committee made the important decision to move all positions to either a government guaranteed money market or a stable value fund. These indicators also went negative in 2000 and 2008. The point is we have a stop loss in place that seeks to stop any further losses until conditions improve. Government stimulus packages will probably provide a temporary market uptick, but will have little impact on the underlying fundamentals and our indicators. In a market decline, think of a person walking down the steps with a yo-yo. The yo-yo goes up and down as the person is walking down the steps but the overall trajectory is still downward.
We also have a buy discipline. As our indicators begin to turn positive again, we will tactically transition by adding specific asset classes and sectors as appropriate. There will be a significant investment opportunity when that happens.
Our decision was not emotional but based on a very methodical process. These are the questions you need to ask. What is your sell discipline? When was the last time it was executed? How effective was it? Your buy discipline is just as important. If you do go to cash to preserve your principal and do not know when to enter back in the market, you may miss one of the most opportunistic times in history. If you are not encouraged by the answers, it may be time for a second opinion.
This month’s topic is definitely heavier than what I normally post, but given our current circumstances I felt it was necessary. If you would like further information on our investment methodology, I am happy to send you over a webinar that was recorded for all our clients. It gives an overview of the data that we used to help our decision-making process. We are willing to share it with you .
In closing, I would like to reiterate our hope for you and your family to remain healthy. I will be praying for all the small businesses in our community who are undoubtedly feeling the strain of social distancing policies. The United States will survive and when we come back, we will be stronger than before. We are here to help support our friends and neighbors however we can in the coming days and weeks. We are in this….together.
Ashley Rosser, President
Prior to her career in the financial services industry, Ashley earned her Bachelor of Science in Nursing from Cedarville University.
Ashley decided to make a career change from her ten years within the healthcare industry as a pediatric emergency room nurse to retirement and 401K investment planning. She joined Victory Wealth Partners in 2008 after obtaining her Series 65 professional financial license and went on to earn her AIF (Accredited Investment Fiduciary) professional designation from the Center for Fiduciary Studies.

The Current Health of the Economy During the COVID-19 Outbreak
While reaction to the Coronavirus COVID 19 continues to remain top of mind, we want to bring attention to the current health of the economy. Generally speaking, we believe there are four different triggers that tend to lead to recession.
The health of the economy in four indicators
The first trigger we look at is unemployment. Just last Friday, it was announced that unemployment fell to 3.5%. In fact, the Labor Department reported that there were 273,000 new jobs in February, nearly 100,000 more than the anticipated number of 175,000.
The second trigger we look for is whether the Federal Reserve’s policy is too tight. When we say that the Federal Reserve’s policy is “tight,” this just means that they are raising interest rates to combat inflation. Currently, the Federal Reserve is loose, as they cut rates by 0.50% on Tuesday, in an attempt to curtail any short-term economic impact from the COVID 19.
The third trigger is overvalued stocks, as it may imply a bubble has formed. In 1999 before the Dot Com Bubble, the Price-to-Earnings ratio (a ratio used to measure stock valuation) for the S&P 500 index was 30.8. Today, this ratio is 22.2, well below the valuations we saw at the turn of the century.
Lastly, the final trigger is geopolitical risk. In a previous piece we wrote on February 5th, we observed every epidemic since 1950 in which there were at least 100 deaths. While one death is one too many from these epidemics, we wanted to objectively analyze how the markets have reacted to each of them. As a recap, the market saw positive returns in the 90, 180, and 365-day periods following the outbreaks, implying that they tend to have little impact on the markets in the intermediate term. In short, none of these four triggers are currently showing weakness.
As we have mentioned in previous articles, movement in the market is typically driven by one of three things: fundamentals, technical analysis, and emotion. Fundamentals in the health of the economy are still sound, with unemployment matching 50-year lows and the economy continuing to beat job growth projections. While supply chains will be affected in the short-term as companies adjust to supply shortages and shipment delays, we don’t believe there will be a long-term impact on these companies. While second and third quarter growth may show an impact, we believe that this will be a temporary decline as opposed to a prolonged issue. On the technical analysis side, our recession indicators continue to remain positive. As a refresher, these indicators would have caused us to exit the market in December of 2000 and July of 2008, well before the worst of each of those recessions. However, these were the only two times in the past 20 years that our indicators would have shown a negative reading. In fact, every indicator was positive through the 2018 correction that saw the S&P 500 fall 19.78%. Sure enough, it was a correction and we recovered with a strong 2019. While we can’t guarantee the same will happen this time, none of the indicators have shown weakness. Lastly, emotional overreaction can drive the markets. Since both the fundamentals and technical indicators are showing strength, we are inclined to believe that this is the driving force behind this market correction.
Like we mentioned in “A History of Market Corrections,” market corrections are a healthy part of investing, as they prevent the stock market from becoming overinflated in value after periods of rapid growth (like the growth we saw in the fourth quarter of 2019). Market corrections historically occur an average of every eight months, and they typically include a catalyst that causes it. In 2010, it was Greece requiring a bailout. In 2015, it was slowing Chinese economic growth. Today, it is a fear of how supply chains will be interrupted due to the Coronavirus COVID 19. It can be difficult to remain disciplined in volatile times, but that is what we strive to do at Victory Wealth Partners. We will continue to analyze the health of the economy and market daily, and we will inform you if we see any material changes in market conditions. However, since we have yet to see any changes, we will continue to stay the course. Volatile times remind us of a letter written by Dean Witter on May 5, 1932:
“Dear Clients, All of our customers with money must someday put it to work-into some revenue producing investment. Why not invest it now, when securities are cheap? Some people say they want to wait for a clearer view of the future. But when the future is again clear the present bargains will have vanished. In fact, does anyone think that today’s prices will prevail once full confidence has been restored? Let us face it-these bargains exist only because of terror and distress. And when the future is assured, the dollar will have long since lost its present buying power. It takes courage, of course, to be optimistic about our country’s future when nearly everyone is pessimistic. But it is cowardly to assume that the future of the United States is in peril.“
It can feel unnatural to be greedy when others are fearful, and it can feel unnatural to be fearful when others are greedy. However, following this old adage has been a sound guide through market history. Stay strong, stay disciplined, and don’t hesitate to reach out if you have any questions or concerns.
Bud Verfallie, CEO
Bud holds several professional designations including: AIFA (Accredited Investment Fiduciary Analyst/Center for Fiduciary Studies), PPC (Professional Plan Consultant/Financial Service Standards), and CFP (Certified Financial Planner/College of Financial Planning), ranking him in the top 1% of all Investment Consultants nationally.
Bud has been an instructor/trainer for over 25 years. Subjects include: “How to Initiate a Successful Asset Management Business in Your Accounting Firm”, “Converting Your Commissioned-Based Investment Practice to Fee-Based”, “How to Establish an Asset Management Practice”, and “Investments and Financial Planning.” Bud has taught financial planners CFP Preparatory classes for the NIF.
Ashley Rosser, President
Prior to her career in the financial services industry, Ashley earned her Bachelor of Science in Nursing from Cedarville University.
Ashley decided to make a career change from her ten years within the healthcare industry as a pediatric emergency room nurse to retirement and 401K investment planning. She joined Victory Wealth Partners in 2008 after obtaining her Series 65 professional financial license and went on to earn her AIF (Accredited Investment Fiduciary) professional designation from the Center for Fiduciary Studies.

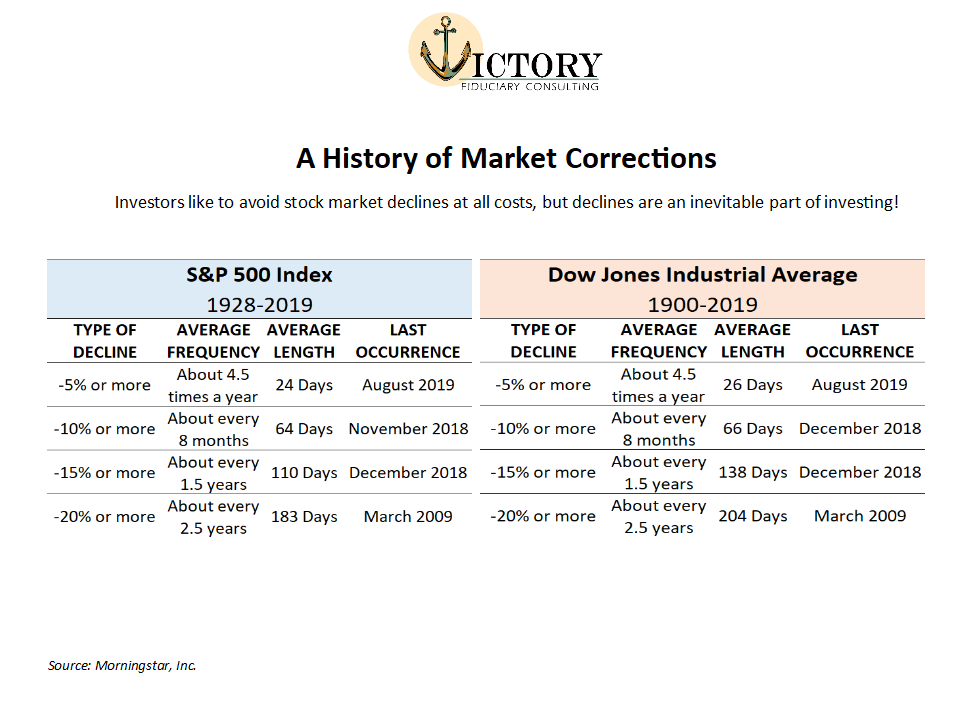
A History of Market Corrections
While the talking heads continue to stoke the flames of hysteria regarding the Novel Coronavirus, we would like to provide a follow-up to our previous article, “Do Global Flus Cause Market Blues”. If you have not read that article yet, we highly suggest you do. We discussed how recent volatility has seemed more pronounced due to an abnormally calm fourth quarter, as well as how the market has reacted to previous epidemics that have had a death toll of at least 100 people. As a recap, the market has averaged positive returns in the 90, 180, and 365-day periods following the initial outbreak, implying that there are other factors that have a much greater impact on the market. This time, however, we would like to discuss a phrase that is thrown around during times of volatility: market corrections.
In the same way a car’s engine can overheat, the stock market can overheat after periods of sustained and, more often than not, rapid growth. At the peak of these growth periods, stocks prices may have even increased faster than their actual underlying value. In these instances, the stock market typically enters a market correction. To put it simply, a market correction is a temporary resetting of market prices. Market corrections typically involve the market falling at least 10%, but they can even fall as much as 20%. In fact, the 2018 correction saw the S&P 500 index fall -19.78%. While no investor wants to see their account down 10%, market corrections are a vital and healthy aspect of our stock market.
As was previously mentioned, market corrections help to prevent the market from becoming egregiously overvalued. Just as the Federal Reserve adjusts interest rates to control inflation, market corrections act as a check on the stock market. While certain asset classes and sectors of the economy can go through isolated corrections, a market correction tends to affect all areas of the market at once. Once the market has seen a broad pullback amongst the sectors of the economy, stocks will once again continue their growth at their newfound prices. In short, market corrections help to ensure our stock market is at a healthy level and valuation.
Now that we have a better understanding of what a market correction entails, the next question is: when do they occur? Unfortunately, there is no crystal ball for predicting corrections. However, we can look at history to create realistic expectations of investing. In the two tables at the end of this piece, you will find a table each for the Dow Jones Industrial Average and the S&P 500, the two major U.S indices. The tables look at each index to observe the frequency of market pullbacks through history. In these tables, you will notice that pullbacks in the market are frequent throughout history. In fact, both indices have historically had a 10% or worse correction every 8 months! For perspective, the market has not had a correction of at least 10% since the end of 2018, meaning that, if history is to be our guide, we have been overdue for a correction. As of Thursday’s market close, we have surpassed the 7% pullback for the S&P 500 and 9% for the Dow Jones. While we can’t know for certain whether this will be closer to the pullbacks of the 2018 correction, we know that history shows us that corrections are a natural and relatively frequent occurrence in our markets.
Finally, the burning question on everyone’s mind: what should I do? While it is much easier said than done to stay the course during a correction, it is imperative that we remain diligent and long-term investors. We are reviewing the market and each asset class daily to see if there are any trend changes,
and we will make adjustments as needed. However, our six recession indicators remain positive, just as they did through the 2018 correction. If we observe any changes to these indicators, we’ll be sure to let you know. In the meantime, our best advice is to remain calm and stay informed. We will continue to do our best to provide you with relevant updates and information, but feel free to reach out to us if you have any questions or concerns.
Thank you,
Bud Verfaillie & Ashley Rosser
Victory Wealth Partners
Anchored in Compliance
53 N. Main St
Mullica Hill, NJ 08062
Office: 856-464-3100
The opinions voiced in this material are for general information only and are not intended to provide specific advice or recommendations for any individual. All performance referenced is historical and is no guarantee of future results. All indices are unmanaged and not to be invested into directly.
The Standard & Poor’s 500 Index is a capitalization-weighted index of 500 stocks designed to measure performance of the broad domestic economy through changes in the aggregate market value of 500 stocks representing all major industries. The Dow Jones Industrial Average Index is a price-weighted index of 30 stocks designed to measure performance of the broad domestic economy through changes in the aggregate market value of 30 stocks representing all major industries.

Is it Time to Leave Your Current Investment Holdings?
Do you know if it is time to leave your current investment holdings or even the stock market in general? Should I stay or should I go now? As the song goes “if I go it will be trouble but if I stay it could be double”. Of course I am not talking about relationships, rather I am referring to when you pull the trigger to sell your positions. Do you have a buy-sell discipline? Unfortunately for most investors, they do not have a formal process that determines if they should make major changes to their investment holdings. Rather, they make changes based on emotions or after something significant happens within the market. This is NOT a very good long-term strategy because unfortunately you are probably hurting your portfolio rather than helping it. Selling your holdings after they have gone down in value or buying positions after they have shot up in value are the equivalent of buying high and selling low. There can always be costs associated with mistiming both exiting and entering the market.
Don’t Leave your current investment holdings because of the nightly news
There is currently significant market volatility thanks to the corona virus outbreak. Many are wondering if this will have a long-term negative effect on their investments. As an Investment Committee, we conducted a study on the long-term effects of new disease outbreaks. We looked at the last 25 epidemics where at least 100 fatalities occurred, which took us back to the 1950’s. Most of the volatility was short-term, occurring in the first 60 days of each new event. If you would like a chart showing the specific epidemics and the volatility associated with specific periods, please contact us. Currently, we are not making any changes to our Investment Models. The stock market in general can be somewhat erratic, although if you have a sound investment management and screening process it can be more predictable that you may realize.
The investment strategy used by our firm, has a well-defined “buy-sell discipline”. This essentially means that there are very specific factors that help us determine when we should be in the market (versus investing in cash) as well as what specific areas of the market appear to offer the best opportunities. We will invest in areas of the market that show stronger performance momentum and conversely avoid areas with weaker momentum. All areas of the stock market will not be strong or weak at the same time. Wouldn’t it be nice to know what areas of the market are currently having strong or weak momentum BEFORE you invest? We decide what specific asset classes and sectors we include in our models based on how strong those areas are performing in current time. Many advisors employ a buy and hold method. They invest in the same asset classes over the long run. They make occasional FUND changes, but they do not change the underlying asset classes and sectors that comprise their portfolios. They periodically rebalance accounts to take from the areas that overgrew and give back to the areas that underperformed. We do not rebalance accounts, which essentially means take from the winners and give to the loser funds. Rather, we keep our models invested in the winners, until the momentum shifts and then we reallocate to a new area that is showing positive performance momentum. We keep our winners until they stop winning.
Only Leave your current investment holdings When ALL Major indicators point to sell.
The last and possibly most important distinction is we have a stop loss set up in our methodology that alerts us if we should consider leaving the market all together. We look at six distinct indicators and if four or more of those indicators turn negative, it is our sign that the stock market will not be the best opportunity for our clients and therefore we will move to cash until a majority of those indicators turn positive again. We will take what the markets will give us, and during the years the markets will be volatile and negative we are willing to be defensive to protect our client’s previous returns and principle. How desirable would it have been to have missed the vast majority of the 2008-2009 financial meltdown?
It is important as an investor to understand there are significant implications associated with both how your current portfolio is invested as well as timing when to get in or out of a specific asset class, sector, or the market in general. You should know if your advisor has a formal buy-sell discipline or they if use a buy and hold and rebalance method. You should also find out if there is a formal stop-loss discipline in place to alert if they should consider moving your account out of the market due to a significant downturn. If you are unsure, we would be happy to help you evaluate your current portfolio. It really is important to know “should you stay or should you go.”
Ashley Rosser, President
Prior to her career in the financial services industry, Ashley earned her Bachelor of Science in Nursing from Cedarville University.
Ashley decided to make a career change from her ten years within the healthcare industry as a pediatric emergency room nurse to retirement and 401K investment planning. She joined Victory Wealth Partners in 2008 after obtaining her Series 65 professional financial license and went on to earn her AIF (Accredited Investment Fiduciary) professional designation from the Center for Fiduciary Studies.

Setting Every Community Up for Retirement Enhancement SECURE Act
Are you familiar with the SECURE Act passed by congress recently? As we start a brand-new decade, many are unaware of this significant bill that was recently passed and is designed to help Americans better prepare for retirement. The Setting Every Community Up for Retirement Enhancement – SECURE Act has many different implications for both the individual retirement investor as well as employers who offer retirement plans. Many investors are unable to keep up with every retirement law as they can be complex to understand and can change frequently. Unfortunately, this means there can be missed opportunities to take advantage of or the potential for negative consequences if the law is not followed. Therefore, it is important to consider finding a financial advisor who keeps up with changes in the industry and relays important information on to their clients. I am going to highlight three areas of the SECURE Act that are important for individual retirement investors to understand.
The first is the changing required minimum distribution age (RMD) from age 70 ½ to 72. This means investors who are no longer working have an extra year and a half before they must begin paying taxes on their qualified accounts. Retirees may still take withdrawals without penalty any time after age 59½. However, as more people work beyond the “traditional” retirement age, and as we continue to live longer, Uncle Sam is giving us an extra 18 months before we must start taking money (and pay the necessary taxes) from our retirement accounts. Individuals who have already begun taking their RMDs prior to 2020 must continue to do so.
The SECURE Act also repeals age restrictions for contributing to IRAs. Individual investors who have earned income will now be able to continue contributing to IRAs beyond the age of 70 ½. It is no surprise that Americans are working longer so it makes sense to allow investors to contribute for longer.
Non- Spouse Inherited IRAs are significantly affect by the SECURE Act because the entire balance of the inherited IRA must now be withdrawn within ten years. Previously, beneficiaries were able to withdraw the account over the course of their own lifetime, otherwise known as a stretch IRA. Tax implications could be quite significant for an inherited IRA since they must be dispersed over a shorter time frame. Exempted beneficiaries to this change include surviving spouses, minor children up until the age of majority, individuals within 10 years of age of the deceased, the chronically ill and the disabled.
These are just three of the changes to individual retirement accounts that are a result of the SECURE Act as there are quite a few other changes not highlighted here. I recommend you consider meeting with a financial advisor who is also a fiduciary to review your accounts and determine if you should make any changes to your current investment plan. A fiduciary is legally obligated to give you advice that is in your best interest. Not all financial advisors take a fiduciary approach so don’t be afraid to ask them if their agreement specifically states that they will be acting as a fiduciary in their relationship with you. As always, the team at Victory Consulting would be honored to sit down with you and help you review your current investment strategy. Best wishes for a prosperous 2020.
Ashley Rosser, President
Prior to her career in the financial services industry, Ashley earned her Bachelor of Science in Nursing from Cedarville University.
Ashley decided to make a career change from her ten years within the healthcare industry as a pediatric emergency room nurse to retirement and 401K investment planning. She joined Victory Wealth Partners in 2008 after obtaining her Series 65 professional financial license and went on to earn her AIF (Accredited Investment Fiduciary) professional designation from the Center for Fiduciary Studies.

Three Financial Strategies for the New Year
What are your financial strategies for the new year? New year, new you. Isn’t that what we all think about from now until the end of the year? How can we make the new year a better one than the previous? We sign up for Gym memberships, declutter our homes, resolve to be more positive, less stressed. Many times we also often vow to make better financial decisions. “This is the year we budget more, spend less. We will save for retirement, build up those college savings accounts”. Sound familiar? I would like to spend a few minutes talking about how you can make 2020 the best financial year of your life.
3 Financial Strategies for the New Year
Financial Strategies for the New Year: #1 Pay yourself first.
Sounds simple right? It is. Decide that you are going to pay a pre-determined amount to your 401k, IRA, or other savings accounts every month and stick with it. Consider it like a bill and eventually it will become habit. Are you thinking that you aren’t sure if you have any extra money left over to pay yourself? Consider that no matter how tight of a budget you run, there is probably 2% of your income that you would not be able to account for. It literally just vanishes each month. Decide for that 2% to appear in your 401k or IRA instead. I usually recommend people increase their savings my 1% every year. It’s like giving yourself a raise and will pay off for you in the long run.
Financial Strategies for the New Year: #2 Put your investment accounts on a budget.
By this I mean, find ways to cut unnecessary expenses from eroding your returns. There are always going to be expenses associated with investment accounts. Unfortunately, sometimes fees are much higher than necessary and they will literally sabotage accounts over a long period of time. If I asked you how much you spend on your cable bill or cell phone each month, you probably know almost to the dollar. If I asked you how much you spend on your investment accounts with all the fees associated, you would probably say “I have no idea”. Consider finding a fiduciary who can sit down with you and itemize out all the expenses within your accounts and then help you determine the reasonableness of them.
Financial Strategies for the New Year: #3 Make sure your investment advisor is working for you.
There are different advisor relationships. The only one that has the legal obligation to act in your best interests first is a fiduciary. Surprised? Most investors have no idea what type of advisor they are working with. Some are paid via commissions; some are paid from the fund companies they recommend and some are paid via level fee arrangements. How do you feel about an advisor who only makes money if he changes funds around in your account? Did you know most advisors will not be able to consistently outperform the S and P 500 over a consistent time period? Considering excessive fees combined with antiquated investment strategies often lead to lagging performance. Our firm uses a dynamic investment methodology that allows us to choose where we invest assets based on current market momentum, not past performance. We are able to identify the winning and losing areas of the market by using a math-based program that tracks supply and demand in the stock market. We avoid weak areas of the market which allows us to strive to outperform the S& P 500 index by at least 1% each year.
As we begin the new year, it is a great time to make sure you are the healthiest you can be both physically and financially. Start off this January giving your retirement account a raise, putting expensive investment accounts on a budget and making sure your advisor is working hard for you. With a little work and forethought, you can make 2020 your most financially healthy year yet. Merry Christmas and Happy New Year from the team at Victory Wealth Partners!
Ashley Rosser, President
Prior to her career in the financial services industry, Ashley earned her Bachelor of Science in Nursing from Cedarville University.
Ashley decided to make a career change from her ten years within the healthcare industry as a pediatric emergency room nurse to retirement and 401K investment planning. She joined Victory Wealth Partners in 2008 after obtaining her Series 65 professional financial license and went on to earn her AIF (Accredited Investment Fiduciary) professional designation from the Center for Fiduciary Studies.